Courtesy of SanDiego.gov:
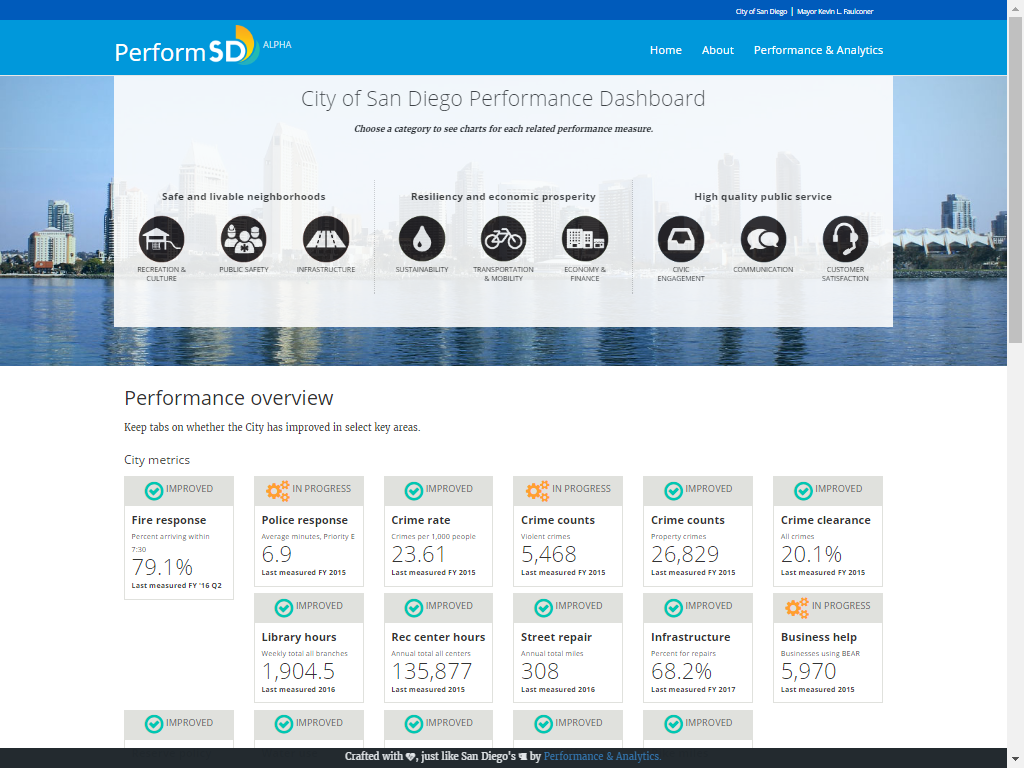
The City of San Diego has unveiled a new Performance Dashboard to allow residents to keep tabs on whether the City has improved in select key areas.
Indicators are grouped by the City’s goals of safe and livable neighborhoods, resiliency and prosperity, and high quality public service.
City metrics are displayed for police and fire response times, recreation center hours, library hours, crime rates, street repair, landfill lifespan, and several others.
City information such as population, education, household income, and housing is also displayed.
This dashboard tracks the City’s Key Performance Indicators (KPIs) and other information. Data about how the City performs is visualized through charts, graphs, and other infographics to tell a story. As a resident, you deserve to know at a glance whether your city is meeting the goals that drive it to improve services.
PerformSD is organized around the City’s Strategic Plan, KPIs in the FY 2017 budget, individual department goals, and inquiries from the public and decision-makers.
These indicators cover a variety of areas, including recreation and culture, public safety, infrastructure, sustainability, transportation and mobility, economy and finance, civic engagement, communication and customer service.
For more information, visit http://performance.sandiego.gov/

